Es geht darum, dass eine Linie im Raum verstanden wird — nicht nur, dass die Zahlen irgendwo stehen.
symviora übersetzt Ihre Geschichte in Bilder, die zu Transaktionen, Programme und Reorganisationen passen:
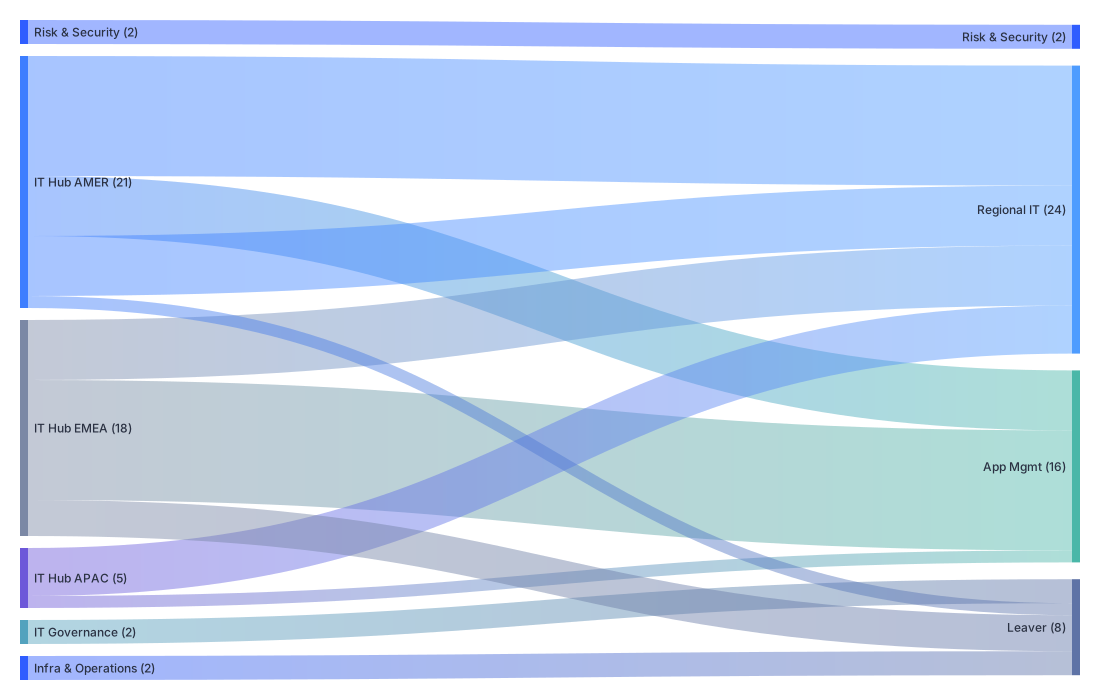
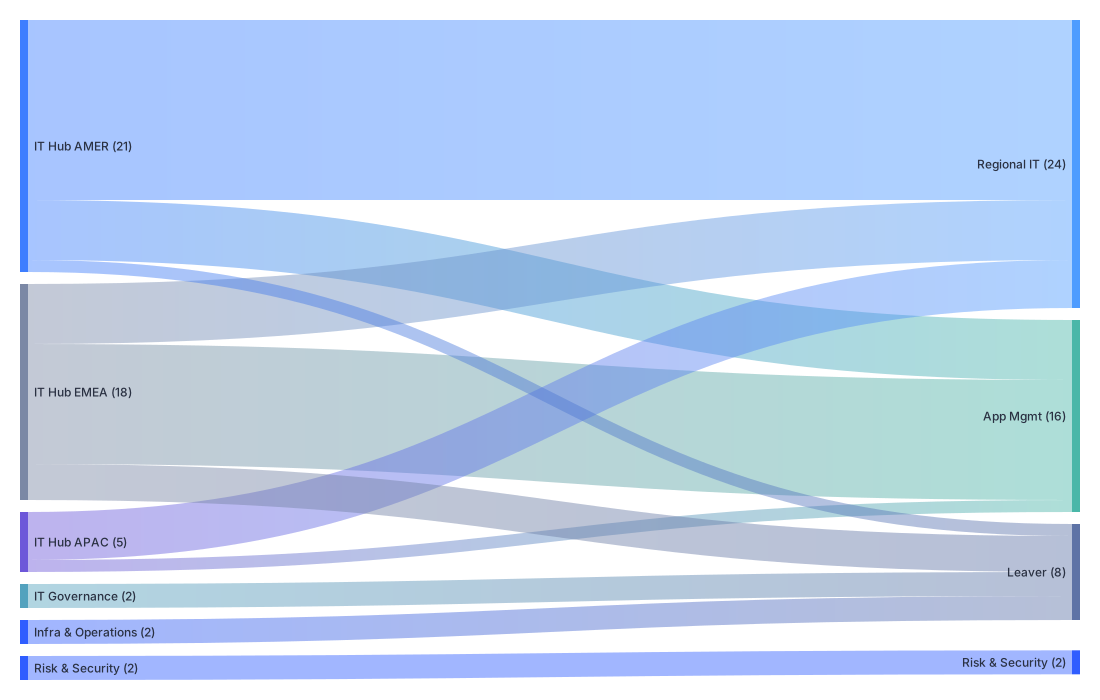
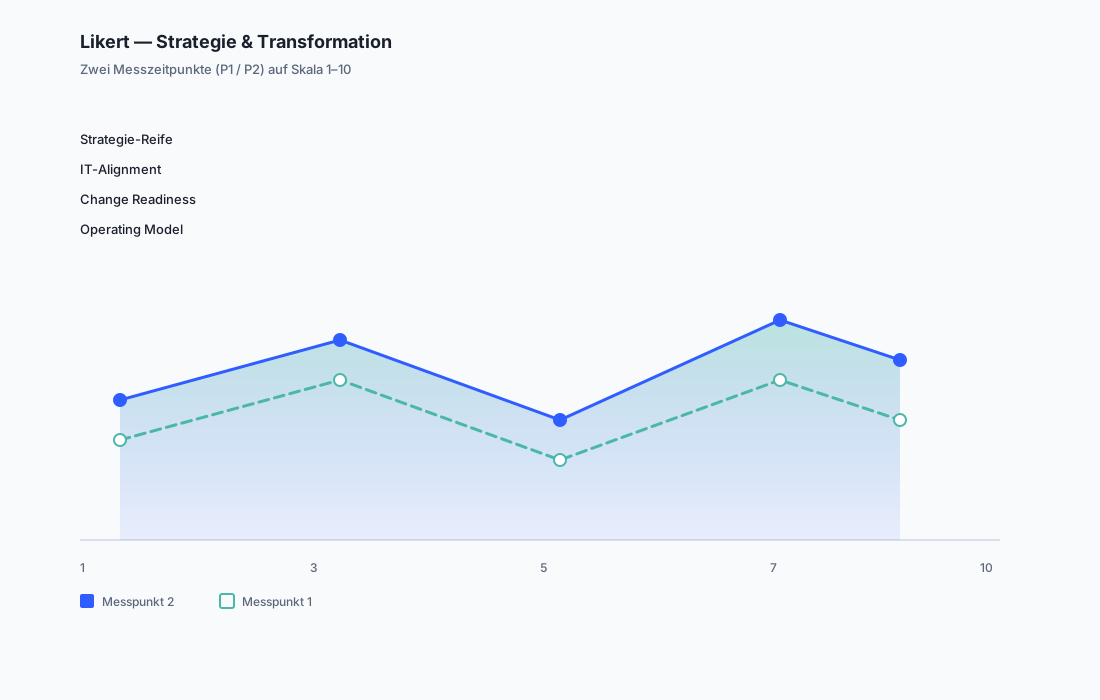
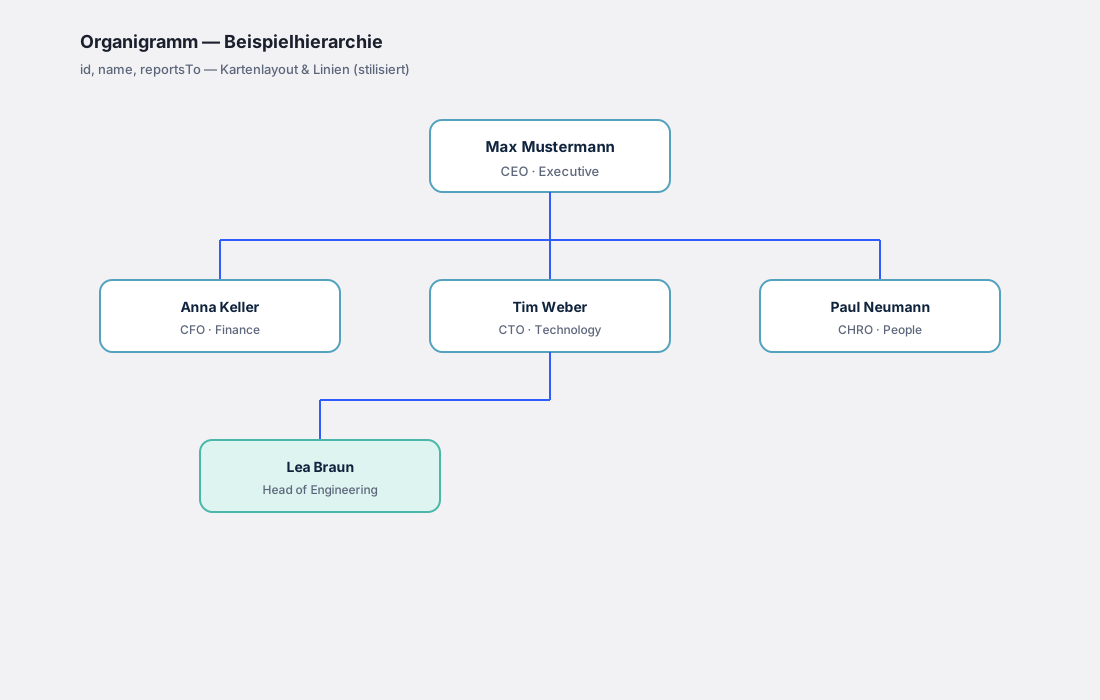
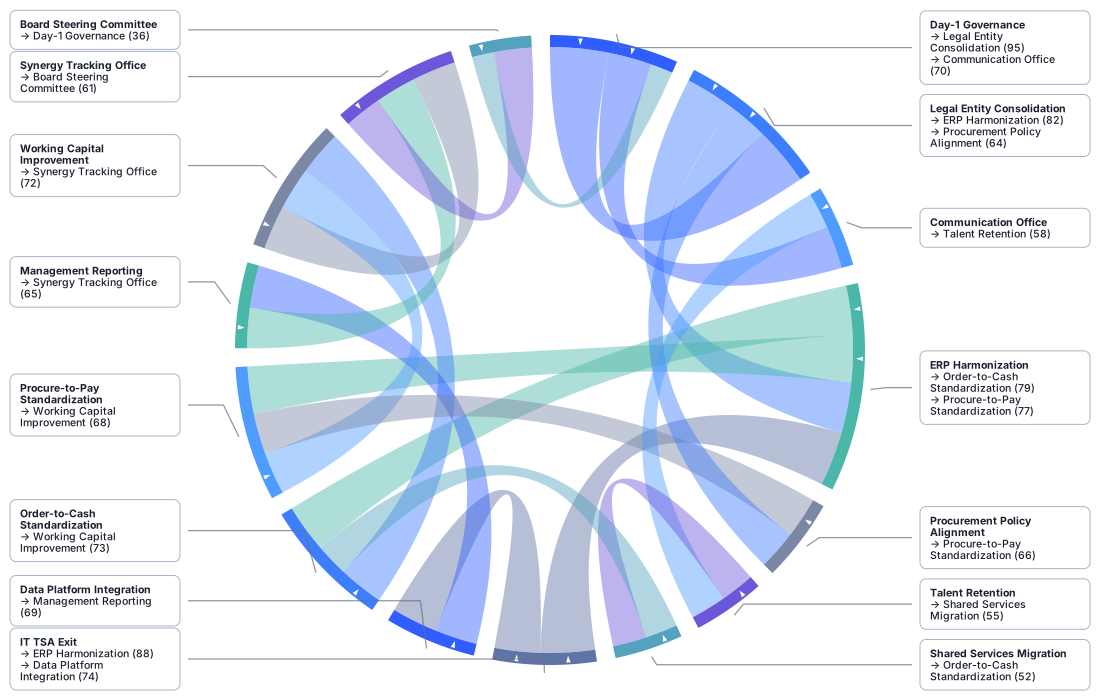
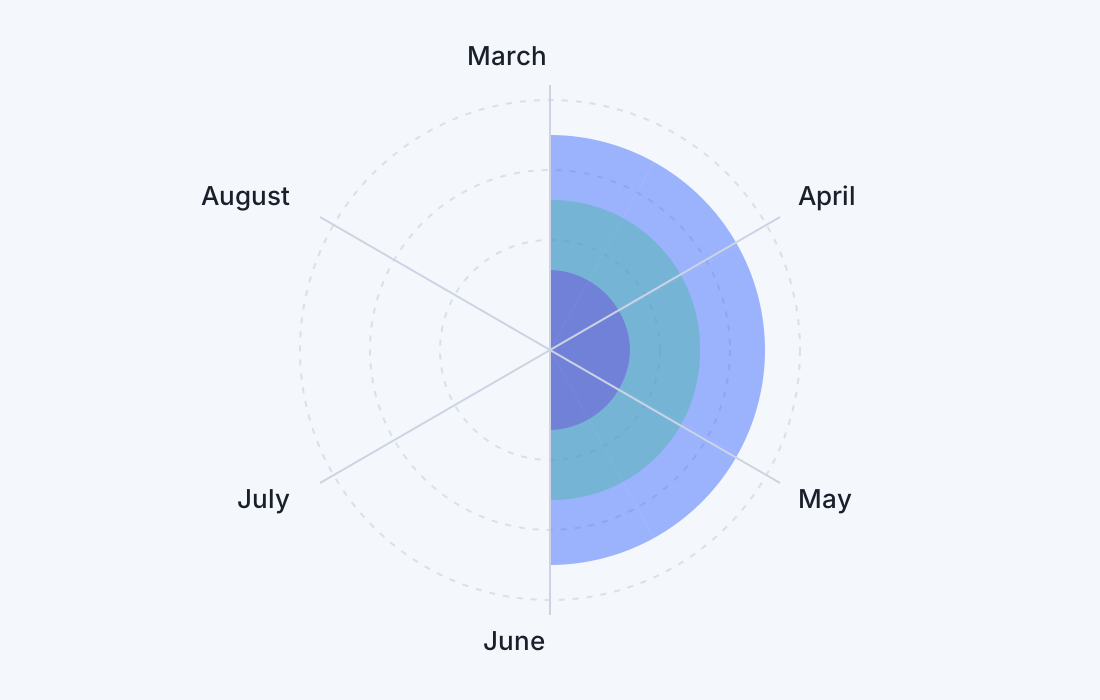
Mittel- und Ergebnisflüsse, Einordnung auf Skalen, Führungsstrukturen, Abhängigkeitsketten und radiale
Vergleiche, wenn es um Anteile und Zeitreihen geht. Ein Set Werkzeuge, ein gemeinsamer Anspruch: eine Grafik,
die Sie vor Partnern, Vorstand oder Ausschüssen mittragen können.
Der Alltag bleibt der Alltag: Sie übernehmen, was Sie ohnehin in Tabellen haben, ziehen die Farbwelt an Ihre
Folien heran und gehen mit Export in die letzte Runde in PowerPoint. Projekte bleiben bei Ihnen — im Browser,
ohne Cloud-Pflicht, so dass das Mandat dort endet, wo Sie es abgeben.
Und weil die Lücke zwischen Modell und Management-Präsentation oft die teuerste ist, arbeiten wir an einem
PowerPoint-Add-in — damit der Weg von der Analyse zur überzeugenden Folie kürzer wird.
What matters is that the story lands in the room — not only that the figures sit in a spreadsheet. symviora
turns your narrative into visuals that fit deals, programmes, and reorganisations: flows of funds and
outcomes, ratings on scales, leadership structures, dependency threads, and radial comparisons when shares and
time matter. Several tools, one promise: a graphic you can stand behind with partners, the board, or
committees.
Day-to-day stays day-to-day: bring over what you already keep in tables, align the palette with your slides,
and export for the final pass in PowerPoint. Projects stay with you — in the browser, with no cloud
requirement, so the engagement ends where you hand it off.
Because the gap between model and management deck is often the costliest step, we are building a PowerPoint
add-in — so the path from analysis to a convincing slide gets shorter.