Für Unternehmensberater und PowerPoint-Perfektionisten For management consultants and PowerPoint perfectionists

Stories sichtbar machen – für Transaktionen, Restrukturierung und Reorganisation. Make stories visible – for transactions, restructuring, and reorganisation.

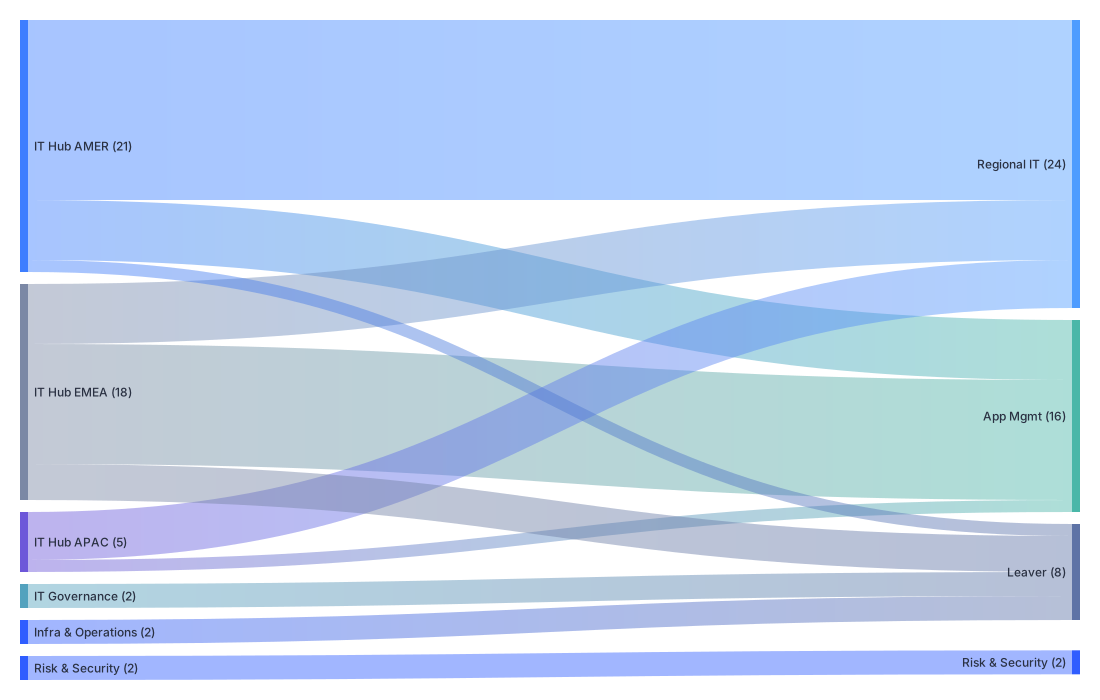
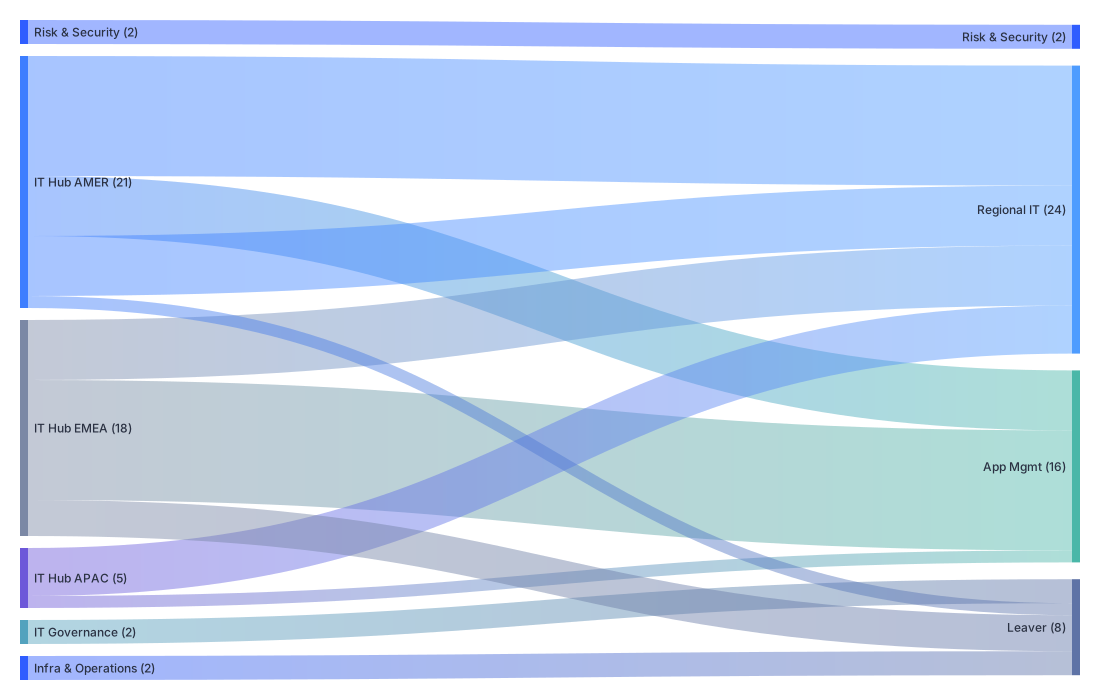
Sankey diagram example: IT reorganisation flows between hubs, regions, and leavers

Sankey und weitere Diagramme für Private Equity, Turnaround- und Transformationsberatung sowie jedes Mandat, in dem Kapital-, Kosten- oder Wertströme in einem Bild belastbar dargestellt werden müssen. CSV aus Excel importieren, Farben auf Ihre (Kunden-)PowerPoint- Vorlagen abstimmen, nach PowerPoint exportieren und Decks management- und board-ready machen. Sankey and other diagrams for private equity, turnaround and transformation consulting, and any mandate where capital, cost, or value flows need to be defended in one picture. Import CSV from Excel, align colours with your (client) PowerPoint theme, export into PowerPoint and make your decks management- and board-ready.

Sicher, weil lokal. Secure, because local.

Für wen das gedacht ist Who it is for

Wenn Sie Geschichten mit Mengen erzählen - nicht nur mit Tabellen. When the narrative is about quantities - not only tables.

Private EquityPrivate equity

Carve-outs, Integration, Werttreiber und Kapitalflüsse zwischen Holding und OpCos - ein Bild für Partner und Committee. Carve-outs, integration, value drivers, and capital flows across HoldCo and OpCos - one view for partners and committee.

Restrukturierung & Beratung Restructuring & consulting

Kosten- und Erlöspfade, Liquidität, Maßnahmenprogramme - verständlich für Stakeholder und Gläubigerkreise. Cost and revenue paths, liquidity, action plans - clear enough for stakeholders and creditor constituencies.

Konzern & Transformation Corporates & transformation

Reorganisationen, Shared-Services-Allokation, Segmentberichte - vom Modell zur Präsentation. Reorganisations, shared-service allocation, segment reporting - from model to management presentation.

Beispiel-Szenarien Example scenarios

Stilisierte Vorschauen für jedes Diagramm-Tool — Flüsse, Skalen, Hierarchie, Abhängigkeiten im Kreis und Polar Area. Die Demo-XLSX laden Sie direkt in die jeweilige App. Weitere Szenarien und alle Downloads bündeln wir auf „Anwendungsfälle“. Stylised previews for each chart type — flows, scales, hierarchy, circular dependencies, and polar area. Download the demo XLSX and open it in the matching app. More scenarios and all downloads are on the Use cases page.

Sankey — Finanz, Budgetüberblick Sankey — finance, budget overview

Eine Quelle, mehrere Ziele: Mittelverteilung auf Bereiche. One pool, several destinations: allocation across functions.

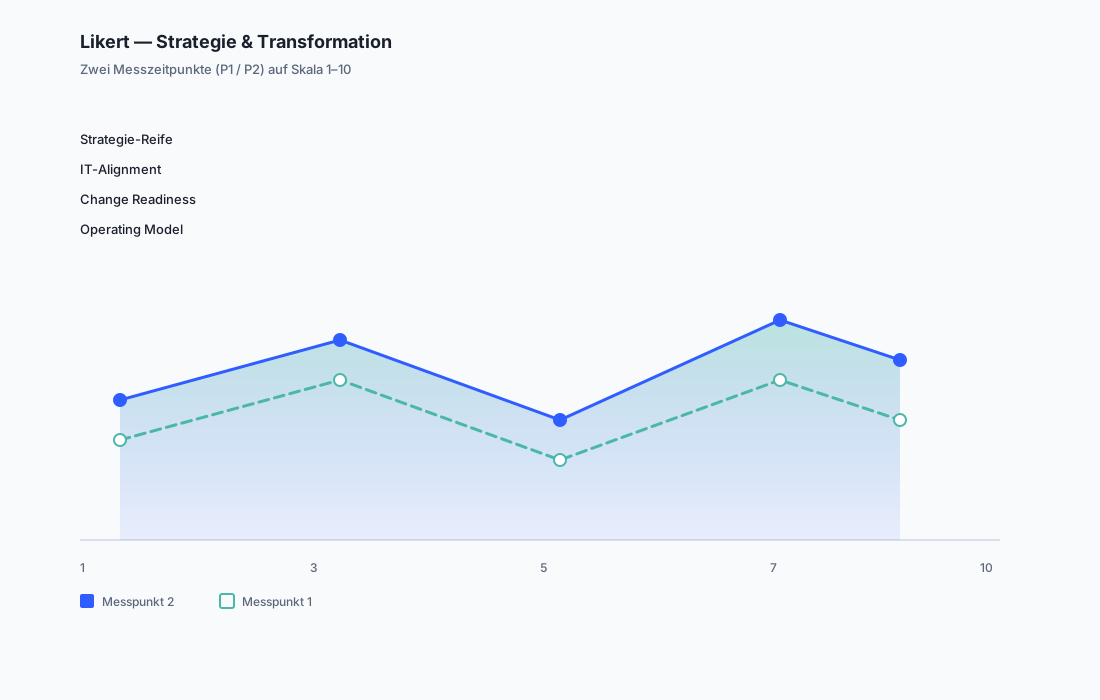
Likert / Snake — Transformations-Reife Likert / Snake — transformation readiness

Mehrere Themen auf einer Skala — gut für Workshop-Readouts und Reifegrad-Linien. Several topics on one scale — ideal for workshop readouts and maturity lines.

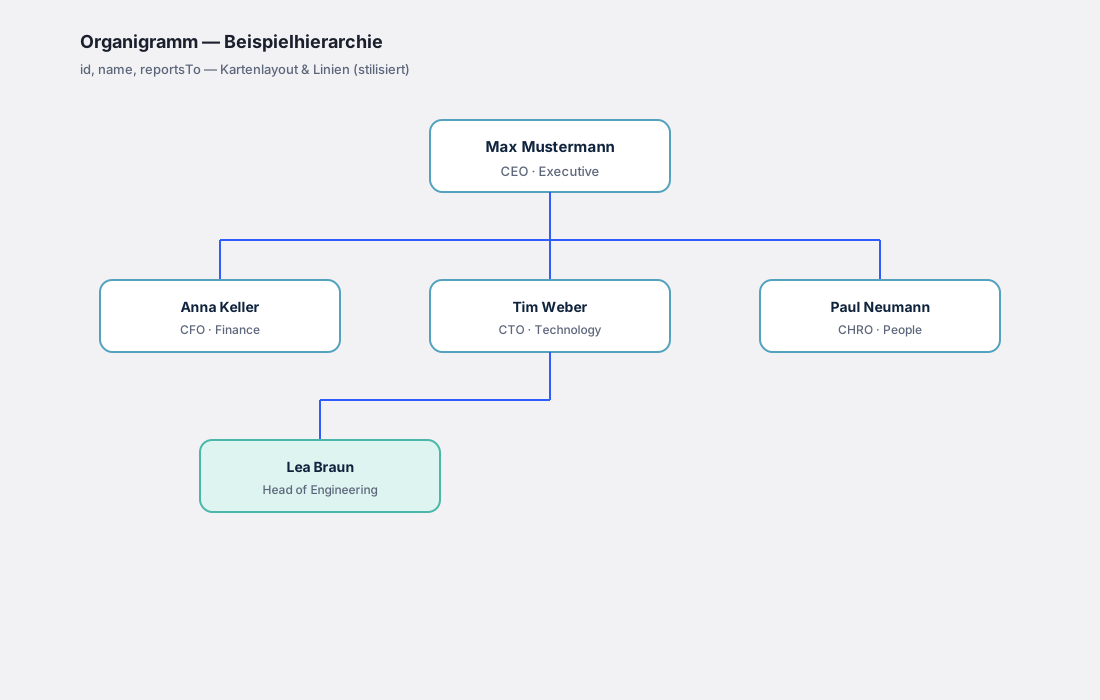
Organigramm — Führungsteam Org chart — leadership team

Hierarchie aus id, name, reportsTo — kompaktes C-Level-Beispiel. Hierarchy from id, name, reportsTo — compact C-level sample.

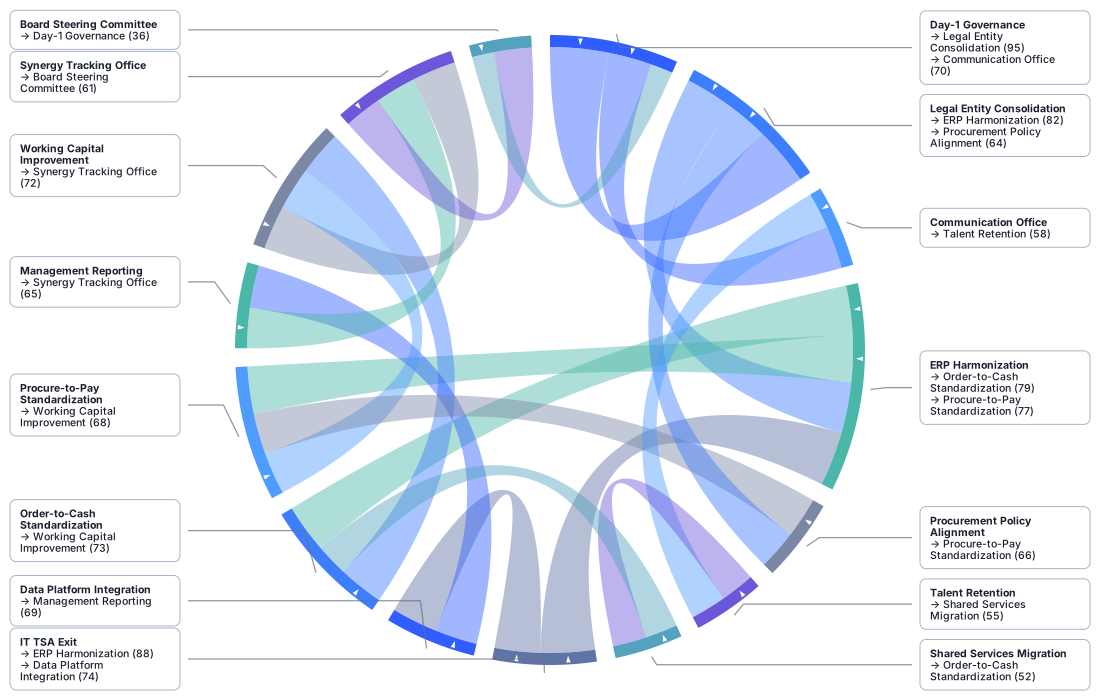
Dependency Circle — Post-Merger-Abhängigkeiten Dependency Circle — post-merger dependencies

Gerichtete Kanten im Kreis — PMI-Szenario aus der Beispielbibliothek. Directed ribbons in a circle — PMI sample from the example library.

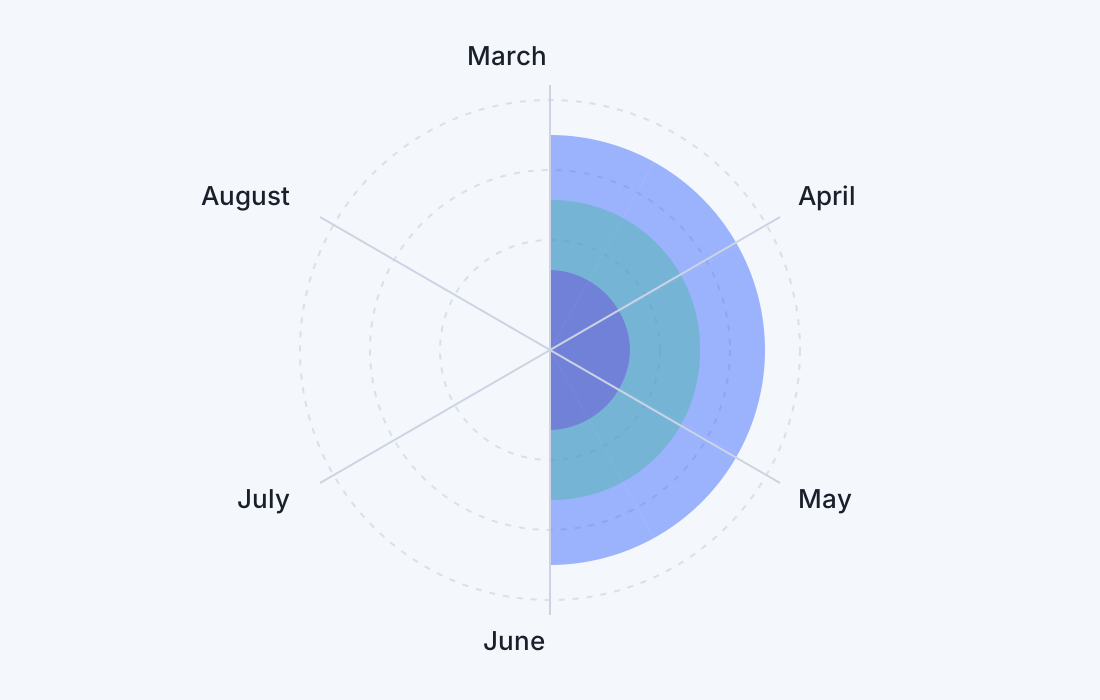
Polar Area — Krimkrieg (Monatswerte) Polar area — Crimean War (monthly values)

Mehrere numerische Reihen radial — wie die mitgelieferte polar-area-sample.xlsx der Polar-Area-App. Several numeric series in the round — same idea as the bundled Polar Area polar-area-sample.xlsx.

Was symviora kann What symviora does

Es geht darum, dass eine Linie im Raum verstanden wird — nicht nur, dass die Zahlen irgendwo stehen. symviora übersetzt Ihre Geschichte in Bilder, die zu Transaktionen, Programme und Reorganisationen passen: Mittel- und Ergebnisflüsse, Einordnung auf Skalen, Führungsstrukturen, Abhängigkeitsketten und radiale Vergleiche, wenn es um Anteile und Zeitreihen geht. Ein Set Werkzeuge, ein gemeinsamer Anspruch: eine Grafik, die Sie vor Partnern, Vorstand oder Ausschüssen mittragen können.

Der Alltag bleibt der Alltag: Sie übernehmen, was Sie ohnehin in Tabellen haben, ziehen die Farbwelt an Ihre Folien heran und gehen mit Export in die letzte Runde in PowerPoint. Projekte bleiben bei Ihnen — im Browser, ohne Cloud-Pflicht, so dass das Mandat dort endet, wo Sie es abgeben.

Und weil die Lücke zwischen Modell und Management-Präsentation oft die teuerste ist, arbeiten wir an einem PowerPoint-Add-in — damit der Weg von der Analyse zur überzeugenden Folie kürzer wird.

What matters is that the story lands in the room — not only that the figures sit in a spreadsheet. symviora turns your narrative into visuals that fit deals, programmes, and reorganisations: flows of funds and outcomes, ratings on scales, leadership structures, dependency threads, and radial comparisons when shares and time matter. Several tools, one promise: a graphic you can stand behind with partners, the board, or committees.

Day-to-day stays day-to-day: bring over what you already keep in tables, align the palette with your slides, and export for the final pass in PowerPoint. Projects stay with you — in the browser, with no cloud requirement, so the engagement ends where you hand it off.

Because the gap between model and management deck is often the costliest step, we are building a PowerPoint add-in — so the path from analysis to a convincing slide gets shorter.
„Ein Muss für jede Unternehmensberatung.“ “A must for every management consultancy.”

Bastian — Strategieberater Bastian — strategy consultant

Bereit für die nächste Management Präsentation? Ready for the next board deck?

Öffnen Sie das Tool und bauen Sie Ihre ersten Flows. Open the tool and build your first flows.

Jetzt kontaktieren Contact us now